Spoiler Alert: There Will Be Math
If you’re a healthcare marketer looking to prove the ROI of your campaigns, we’ve got good news and bad news. The bad news? ROI calculations involve some math (sorry about that). The good news? The right math gives you undeniable proof of your marketing impact—and that’s worth every equation.
At LionShare, we’re big fans of breaking things down to what really matters. That’s why we’re diving into how control groups—and yes, some simple math—can transform your marketing strategy from “pretty good” to “provably effective.”
Why Math (and Control Groups) Matter
When your CFO asks, “Wouldn’t those patients have come in anyway?” you need more than a shrug or a hunch. You need data that tells the story. That’s where control groups come in.
Control groups are the unsung heroes of marketing measurement. By comparing those who received your campaign to those who didn’t, you get a crystal-clear view of your campaign’s true impact. Think of it as finding the difference between what would have happened naturally and what your campaign achieved.
The Steps (and Math) Behind ROI
Here’s how you calculate ROI like a pro:
- Define your groups
Select your campaign group and your control group. Typically, your control group will be about 10% of the size of your campaign group. - Track performance
Over a set period (say, a year), measure the downstream revenue generated by both groups. - Equalize the control group
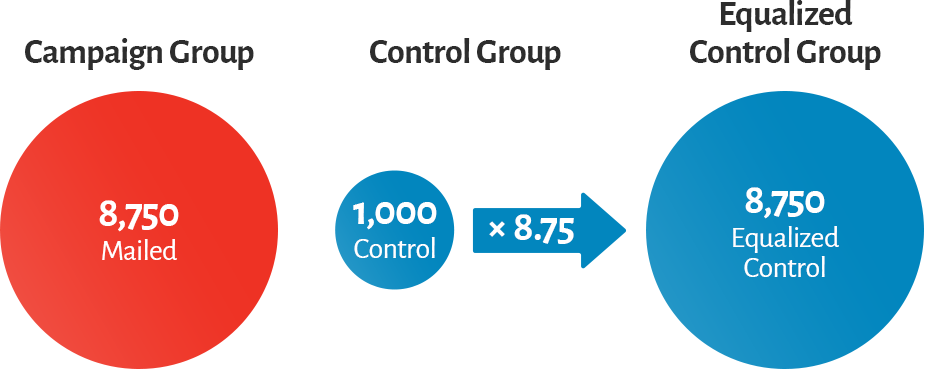
Since the Campaign group and the Control group are not equal in size, to properly compare, it’s important to look at what the outcome would be if the control group was assumed to be the same size as the mailed quantity in the campaign group.For example, if your campaign group is 8,750 households and your control group is 1,000, to find the multiplier needed, divide the Mailed quantity by the Control quantity (8,750/1,000) to get 8.75.
The multiplier is used to determine the expected results of the Control group revenue.

- Calculate the lift in revenue
Subtract the equalized control group revenue from the campaign group revenue. This tells you how much additional revenue your campaign generated. - Plug into the ROI formula
Use this equation:ROI = Lift in Revenue − Campaign Cost Campaign Cost × 100 - Interpret the ROI
ROI percentages can feel abstract, so translate them into something relatable. For example, an ROI of 165% means for every $1 spent, your campaign brought in $1.65.
ROI in Action
To help show how to apply these formulas, we’ll walk through a hypothetical campaign using the equalization numbers we calculated above. Let’s say these are for a campaign for primary care services with the following results:
- Campaign Group Revenue: $85,000
- Control Group Revenue: $6,150
- Campaign Cost: $10,000
Here’s how we get to the ROI staring with step 3:
- Equalize the control group:
Using the numbers from above, we can then apply the equalization factor of 8.75 to the control group revenue:$6,150 x 8.75 = $53,812.50
- Calculate the lift in revenue:
We get the Lift in Revenue by subtracting the equalized control group revenue from the campaign group revenue$85,000 − $53,812.50 = $33,187.50
- Calculate the ROI:
Using the ROI formula on our numbers get us the following:ROI (%) = 85,000 − 33,187.50 10,000 × 100 = 518.13% - Interpret the ROI:
A 518.13% ROI means your campaign generated $5.18 for every dollar spent.
Why the Math is Worth It
Sure, math might not be the most exciting part of marketing, but it’s essential for proving your value. Without it, you’re relying on guesswork. With it, you’re showing leadership how your marketing dollars drive measurable results.
And if you ever need help crunching the numbers (or convincing your CFO), LionShare is here. We bring the math, the strategy, and the smarts to make your marketing work harder—and prove it.
Give us a call. We promise, there won’t be a test.

Comments